Sometime back I presented a webinar on BrightTalk. The slides for the talk have now been uploaded on Slideshare. The talk focused more on changes in digital technology disrupting businesses, the effect of Big Data, the FOMO (Fear of missing out) effect on big business - and what it meant for changes to the way we do business intelligence in the digital era.
The outsourcing model which led to the “on-demand” “as a service” model, has taken off with increasing adoption of cloud-computing and mobility. What started out with the SaaS – software as a service model, has now diversified into several other services.
Indeed, cloud computing has come to rest on three of these as its core pillars:
Probability concepts form the foundation for statistics.
A formal definition of probability:
The probability of an outcome is the proportion of times the outcome would
occur if we observed the random process an infinite number of times.
This is a corollary of the law of large numbers:
As more observations are collected, the proportion of occurrences with a particular outcome converges to the probability of that outcome.
Disjoint (mutually exclusive) events as events that cannot both happen at the same time. i.e. If A and B are disjoint, P(A and B) = 0 Complementary outcomes as mutually exclusive outcomes of the same random process whose probabilities add up to 1.
If A and B are complementary, P(A) + P(B) = 1
The BIguru BI Blog app is now available on the Amazon AppStore!
To search and download the app, go to the Amazon AppStore and search for “Biguru BI Blog”.
To download and install, you’ll need to follow instructions for your Android smartphone, i.e. you’ll need to “enable unknown sources” as outlined by Amazon.
Once you’ve downloaded and installed it (your smartphone Anti-Virus should scan the app after installation) by accepting the defaults, you’re free to get updates on new posts from this blog!
What is Statistics?
Collected observations are called data. Statistics is the study of how best to collect, analyze, and draw conclusions from data. Each observation in data is called a case. Characteristics of the case are called variables. With a matrix/table analogy, a case is a row while a variable is a column.
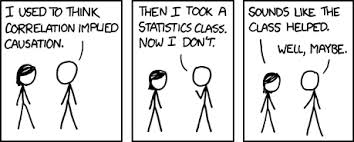
Statistics - Correlation (Courtesy: xkcd.com)
Types of variables:
Numerical - Can be discrete or continuous, and can take a wide range of numerical values.
Categorical - Specific or limited range of values, usually called levels. Variables with natural ordering of levels are called ordinal categorical variables.
A pair of variables are either related in some way (associated) or not (independent). No pair of variables is both associated and independent.
Data collected in haphazard fashion are called anecdotal evidence. Such evidence may be true and verifiable, but it may only represent extraordinary cases.
There are two main types of scientific data collection: