How can you reduce development costs and improve software reliability and accuracy at the same time? How can you make IT work together with Business while architect-ing your BI applications? If these goals sound contradictory and difficult to achieve, then Agile development may well fit the bill. Indeed in numerous BI projects, one or the other flavor of Agile is used to attain these very goals.
Defining Agile
There are several Agile development methodologies available:
Taking its place would be SAP Strategy Management (a product biguru is SAP certified). SAP Strategy Management is the new name for what used to be Pilot Software’s flagship product PilotWorks product, which SAP acquired in February 2007. No doubt about the fact that PilotWorks Server which is based on a powerful OLAP engine, and has an extremely user-friendly GUI on top of it, is a few notches above the clunky Performance Manager of BOBJ.
Business Objects has just released the updated Xcelsius 2008 after a long beta program. What are the top new features of this exciting data visualization and dashboard tool? Let’s find out the top 10:
Copy-Paste - Productivity is bound to increase through collaborative development now as it is possible to copy-paste components between XLF files.
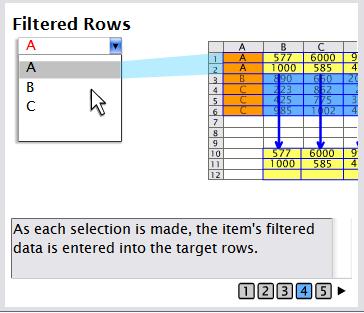
Filtered Rows - Selector components like List box and combo-box now include a new option in the insert-options list. This is the “Filtered rows” option, automatically removing duplicates. In the previous version, this worked only with the Filter component.
Color-scheme - The new-look Xcelsius 2008 has some amazing pre-built color schemes, including “auto-matching” of colors and allowing color configuration of backgrounds, text, buttons, charts, selectors, single value components, maps and scroll bars. A notch above the existing Xcelsius with its garish and glossy color schemes. 3 new themes - Admiral, iTheme and Nova have also been added to the existing set.
History component - This is a very useful new feature which captures a single-cell value and inserts it into a contiguous row/column of data, thus allowing the designer to track changes based on data refreshes, user selections etc. Used with XML Data connection, this can be used for exporting data snapshots out of Xcelsius.
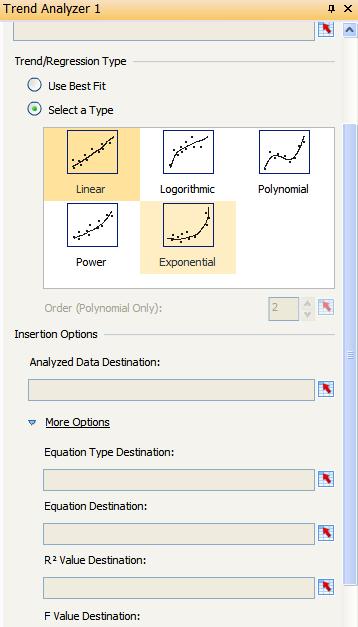
Trend Analyzer component - This component automatically inserts linear, logarithmic calculations into charts, tables, and other components at runtime. You can choose the order of the polynomial. Alternatively, you can let Xcelsius decide the best fit for the trend.
Dual Y-Axis option - A long standing wish of the Xcelsius developer community, the secondary axis charting has now been made available on line, column, stacked column, bar, stacked bar, combination, chart, area, and stacked area charts. Earlier, the workarounds included using multiple copies of the chart and overlaying them with clever formatting and dynamic visibility.
Alerts in selector components - This feature allows configuring selectors e.g. combo-box, list-box etc to display alerts icon for each label. It also has a new “Middle values are good” option for percent alerts in the color-order section.
Data Manager - A redesigned development interface now includes a new Data Manager, which consolidates the various possible external data sources including QaaWS, XML data, portal, Live Office, XML maps, flash variables, crystal reports, Adobe Life cycle data services and web services. There is also a general option available to import data from a spreadsheet in the Business Objects Enterprise.
Slick new IDE - The new IDE is created using Adobe Flex and includes an embedded Excel sheet which improves productivity by allowing the designer to make changes to the model within the IDE, rather than Alt-Tab-bing between Excel and Xcelsius. There are several one-touch Quick-views available - the integrated workspace, canvas only, Excel only and both canvas-and-Excel. And all those floating bars can be pinned or auto-hidden. While dragging and dropping, scroll arrows appear over the toolbars, and it takes a little while to adjust to the way you can dock these bars.
Component management - Has been made easier in that you can select individual components within a group and modify its properties, including sending it back or forward within the group. Hiding and locking of components and groups have also been made very easy.
SaaS has taken off in a big way in the past few years. And BI has not been lagging behind. For leading vendors like BOBJ (an SAP company) or Cognos (an IBM company), it’s going to be close to 2 years now since they started their SaaS BI.
What exactly are the advantages of SaaS over the traditional approach?
Benefits are aplenty, from zero costs of purchasing hardware, hiring of key IT personnel like system administrators and DBAs, to minimal implementation and maintenance costs. With CRM being made affordable to SME (small and medium-sized enterprises) by salesforce.com (note the huge success of its AppExchange), and the fact that large enterprise adoption of BI was complete, meant that the only scope for future growth in BI would come from upgrades of platforms (analogous to Microsoft’s Windows operating system - think of BOBJ upgrading from 6.5 to XI) or from expansion in the SME space with better offerings.
Last time I talked about the trends in the BI space. Let’s look into one of those trends - M&As and how it is shaping BI as we know it.
A recent BusinessWeek article claimed the end of the best-of-breed approach to BI with the demise of the major pure-play BI vendors like BOBJ now owned by SAP thanks to a friendly takeover or Hyperion acquired by Oracleor the latest - IBM’s acquisition of Cognos. While it is true that some of the major players have been acquired by the bigger businesses, there is no reason as to why the mid-size companies should go out of business.